How much does the average car weigh?
About 4,054 lb at the curb for a new model-year-2024 vehicle — and the 300 lb asterisk on that number is the part everyone quotes wrong.
Last updated .
The number, stated carefully
EPA’s fleet data puts the average model-year 2024 vehicle at 4,354 lb — within a hair of the heaviest average ever recorded, and up from 3,228 lb at the 1980 light point. But that figure carries a footnote most pages that quote it have never read: EPA publishes inertia weight, defined in the report itself as “vehicle curb weights plus 300 pounds.” The average new vehicle’s curb weight — the number on your door-jamb sticker, the one a scrapyard cares about — is therefore about 4,054 lb for model year 2024.
Why cars got heavy
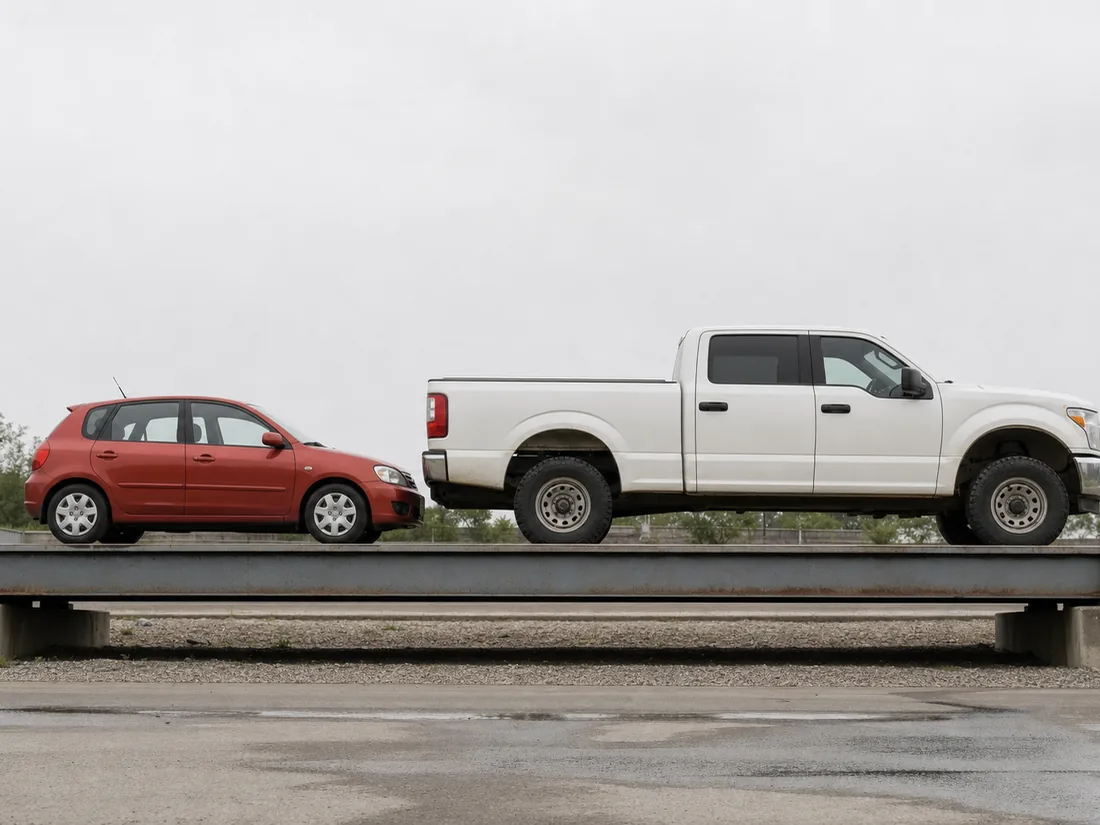
Half the story is what a vehicle is now: in 1975, 81% of new vehicles were cars; in model year 2024, 66% were trucks, SUVs or vans. The average vehicle got heavier partly because the average vehicle stopped being a car. The other half is that everything within each class grew — safety structure, sound deadening, size, and lately battery packs.
| Model year | Inertia wt (lb) | ≈ Curb wt (lb) | HP | Truck/SUV share |
|---|---|---|---|---|
| 1975 | 4,060 | 3,760 | 137 | 19% |
| 1980 | 3,228 | 2,928 | 104 | 16% |
| 1985 | 3,271 | 2,971 | 114 | 25% |
| 1990 | 3,426 | 3,126 | 135 | 30% |
| 1995 | 3,613 | 3,313 | 158 | 36% |
| 2000 | 3,821 | 3,521 | 181 | 41% |
| 2005 | 4,059 | 3,759 | 209 | 44% |
| 2010 | 4,001 | 3,701 | 214 | 37% |
| 2011 | 4,126 | 3,826 | 230 | 42% |
| 2012 | 3,979 | 3,679 | 222 | 36% |
| 2013 | 4,003 | 3,703 | 226 | 36% |
| 2014 | 4,060 | 3,760 | 230 | 41% |
| 2015 | 4,035 | 3,735 | 229 | 43% |
| 2016 | 4,035 | 3,735 | 230 | 45% |
| 2017 | 4,093 | 3,793 | 234 | 47% |
| 2018 | 4,137 | 3,837 | 241 | 52% |
| 2019 | 4,156 | 3,856 | 245 | 56% |
| 2020 | 4,166 | 3,866 | 246 | 56% |
| 2021 | 4,289 | 3,989 | 254 | 63% |
| 2022 | 4,303 | 4,003 | 260 | 63% |
| 2023 | 4,372 | 4,072 | 268 | 62% |
| 2024 | 4,354 | 4,054 | 258 | 66% |
| 2025 (prelim) | 4,441 | 4,141 | 264 | 65% |
Methodology
Every figure is transcribed from Table 3.1 of the EPA Automotive Trends Report (EPA-420-R-26-001, February 2026), the agency’s annual census of new light-duty vehicles; 2025 values are the report’s preliminary estimates. The curb-weight column is that table minus the 300 lb EPA states it adds — an arithmetic step, shown rather than hidden, because the two weights are routinely conflated. These are averages of new vehicles: the average car on the road, and the average car being scrapped, is older and lighter — roughly the 2010–2014 rows of the table.
Sources
- EPA Automotive Trends Report — Table 3.1, Vehicle Attributes by Model Year; public domain
- Report PDF (EPA-420-R-26-001) — the page the table sits on
Citing this page. Every weight on this page is EPA’s own Table 3.1, minus the 300 lb offset the report itself defines. A suggested citation: “How Much Does the Average Car Weigh? EPA Data, 1975-2025,” Sell My Car Hub, sellmycarhub.com/guides/average-car-weight/, data as of 2026-08-25. The charts may be reproduced with a link to this page.
Related: what a ton of that steel trades for · used-car prices over the same decades.