Sell My Car Hub

Best and worst drivers by state, ranked from crash data

Most worst-drivers lists are built from one company's insurance quotes or a survey of people describing themselves. This one is built from the crash data the federal government publishes: deaths per mile driven and per resident from NHTSA's Fatality Analysis Reporting System, the share of those deaths involving an alcohol-impaired or speeding driver, and the seat belt use each state observed on its own roads. All 50 states are in one table for 2024, the latest complete year. The ranking is ours and the weights are printed. The facts are NHTSA's.

Last updated .

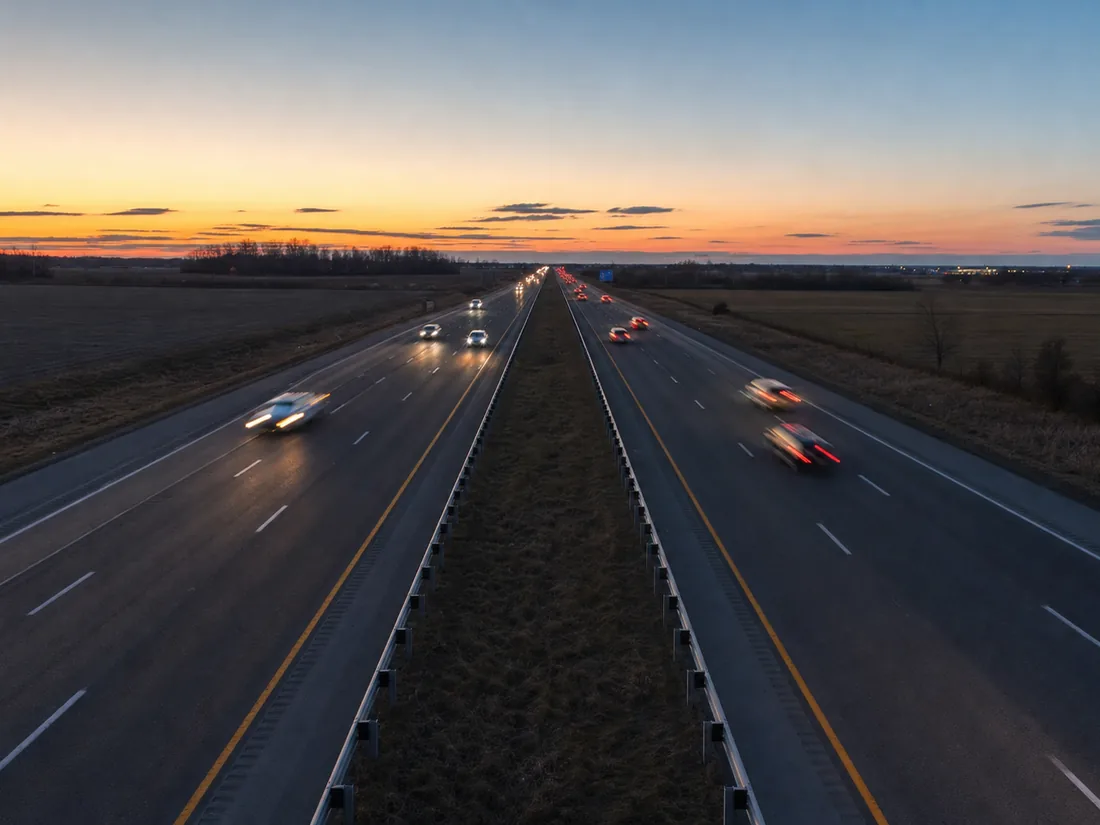
Light traffic on a divided interstate at dusk seen from an overpass, headlights and tail lights streaking, flat farmland on both sides

The numbers are NHTSA's, the weights are ours, and both are printed here

Every column in the table below comes from a government table for calendar year 2024, the most recent full year in NHTSA's state tables. Deaths and deaths per 100 million vehicle miles come from NHTSA's FARS state table, 2024 first release. Deaths per 100,000 residents come from IIHS's Fatality Facts 2024 state page, which pairs the same FARS counts with Census population and was posted in June 2026. The alcohol-impaired share is from NHTSA's State Alcohol-Impaired-Driving Estimates for 2024 (published July 2026), the speeding share is from the IIHS compilation, and belt use is each state's own observed survey as reported in NHTSA's Seat Belt Use in 2024 state note.

The composite is where we step in. For each of five measures we ranked the states 1 (best) to 50 (worst), then combined the ranks with these weights: 40% deaths per 100 million miles, 30% deaths per 100,000 people, 15% observed belt use, 10% share of deaths in crashes with an alcohol-impaired driver, and 5% share of deaths in speeding-related crashes. Where two states print the same value in a column, both take the same rank and the next value down skips a number. The lowest weighted score ranks first; ties on the score go to the state with the lower per-mile rate. Outcomes carry 70% because they are counts, not judgment calls. The behavior shares get the least because they depend on how much a state tests and how officers code a crash; NHTSA itself warns readers to be very careful when comparing alcohol involvement from one state to another. The District of Columbia is left out because it is not a state.

The national backdrop matters. NHTSA's 2024 overview counts 39,254 deaths, a 4.3% drop from 41,025 in 2023, with the rate falling from 1.26 to 1.19 deaths per 100 million miles. A state at 1.19 is average, not safe.

All 50 states in one table, from Minnesota at the top to Montana at the bottom

All figures are for 2024. The two death rates are the raw FARS numbers. The alcohol and speeding columns are the share of that state's own crash deaths, not a rate. Belt use is the daytime observed rate for front-seat occupants from each state's survey. The rural column, the share of each state's deaths on rural roads, is there because it explains more of the table than anything else.

RankStateDeaths per 100M milesDeaths per 100,000 peopleAlcohol-impaired shareSpeeding shareBelt useRural share of deaths
1Minnesota0.818.223%29%94.7%58%
2New Jersey0.847.122%23%90.4%15%
3Utah0.777.926%30%90.7%49%
4Massachusetts0.595.127%29%84.4%8%
5Rhode Island0.684.737%31%90.5%13%
6New York0.915.527%33%91.9%26%
7Hawaii0.967.134%42%97.2%13%
8Connecticut1.008.434%41%95.0%13%
9Indiana0.9412.025%26%93.6%59%
10Maryland1.019.229%20%90.6%18%
11Vermont0.829.141%54%88.4%71%
12Wisconsin0.8610.033%32%89.2%57%
13Iowa1.0511.033%20%94.0%64%
14Illinois1.139.329%36%92.4%32%
15Michigan1.1010.828%25%92.0%41%
16New Hampshire0.969.429%29%78.2%56%
17North Dakota0.9011.330%22%79.8%81%
18Ohio1.009.737%17%85.2%43%
19California1.199.834%29%97.5%27%
20Washington1.219.233%34%94.6%40%
21Virginia1.0410.427%31%81.8%50%
22Pennsylvania1.188.626%39%87.6%39%
23Maine1.1712.628%24%93.8%80%
24Georgia1.1512.523%24%88.8%35%
25Alaska1.279.519%50%92.1%53%
26Kansas1.0711.435%21%86.2%55%
27Delaware1.2712.026%25%92.3%40%
28Florida1.2613.424%11%90.0%21%
29Nebraska1.1512.530%27%80.2%65%
30Idaho1.1911.930%24%85.7%75%
31North Carolina1.2414.728%42%92.8%62%
32Missouri1.1715.327%33%88.3%47%
33Colorado1.2511.630%34%88.2%34%
34Oregon1.4412.633%30%95.5%54%
35Nevada1.4712.833%33%94.8%25%
36Alabama1.3218.729%29%92.2%59%
37Kentucky1.4415.424%13%87.8%62%
38Louisiana1.3616.425%28%88.4%45%
39Wyoming1.1018.232%39%73.4%75%
40Texas1.3513.340%36%90.1%36%
41West Virginia1.4914.530%30%92.0%56%
42South Dakota1.4015.830%23%88.6%80%
43New Mexico1.4319.228%36%93.6%64%
44Tennessee1.5216.628%19%92.2%40%
45Oklahoma1.3915.735%37%86.4%58%
46Arizona1.7416.234%36%89.5%30%
47Mississippi1.8125.623%17%81.2%67%
48Arkansas1.5319.526%23%77.7%68%
49South Carolina1.6718.940%38%89.7%46%
50Montana1.4918.137%43%79.3%79%

Three reading rules. The two rate columns can disagree, usually because residents drive very different amounts. A state can rank well with an ugly number in one column; that is what a composite is for. And in states with fewer than 150 deaths a year, one bad weekend moves a share by several points, so treat single-year positions for Vermont, Wyoming, Alaska and the Dakotas as a snapshot.

Rural miles, not bad drivers, explain most of the gap between the top and the bottom

NHTSA's rural and urban fact sheet for 2023 lays out the mechanism in three numbers: about 20% of Americans lived in rural areas and 31% of miles were driven there, yet rural roads produced 41% of all traffic deaths. Per mile, the same sheet puts the rural death rate at 1.65 per 100 million miles against 1.07 in urban areas, and notes that 64% of rural deaths were roadway-departure crashes, the car leaving the lane at speed with nothing forgiving to hit.

That is why the rural column tracks the ranking so closely. In IIHS's 2024 tally, the highest rural shares of crash deaths belong to North Dakota at 81%, Maine and South Dakota at 80% and Montana at 79%; the lowest to Massachusetts at 8% and to Connecticut, Hawaii and Rhode Island at 13%. Massachusetts is first per mile; Montana is last on the composite.

Miles per resident is the other half. Divide IIHS's vehicle miles by population and Wyoming's residents covered roughly 16,541 miles each in 2024 while New York's covered about 6,084 (our arithmetic on IIHS's figures). Wyoming's per-mile rate of 1.10 is better than the national 1.19, yet its per-capita rate of 18.2 is the sixth worst in the country. Nobody drives worse in Wyoming than in Michigan, which has the same per-mile rate; people there simply drive about 70% farther (roughly 16,500 miles per resident against Michigan's 9,800), mostly on two-lane roads far from a trauma center.

IIHS puts the caveat on its own page: fatality rates depend on the vehicle mix, travel speeds, how many residents hold licenses, traffic laws, distance to emergency care, weather and terrain. A ranking of states is mostly a ranking of geography, with driver behavior layered on top.

Alcohol and speed are where a state's drivers actually earn the label

Nationally, NHTSA estimates that 11,904 people, 30% of all 2024 traffic deaths, died in crashes involving a driver at or above 0.08 BAC. By state the share ran from 41% in Vermont down to 19% in Alaska, with South Carolina and Texas at 40%. Measured per mile, the alcohol-impaired death rate ranged from 0.16 in Massachusetts to 0.67 in South Carolina, against 0.36 nationally. Speeding is similar in shape: IIHS counts 29% of 2024 deaths as speeding-related, from 54% in Vermont and 50% in Alaska down to 11% in Florida and 13% in Kentucky.

Two cautions before anyone points at Vermont. The first is testing. NHTSA reports that the share of drivers in fatal crashes with a known blood alcohol result ranged from 8% in Mississippi to 86% in Montana; where results are missing, NHTSA estimates them statistically. Mississippi's 23% alcohol share therefore rests on a very thin tested base. That is the main reason the state with the worst death rate per mile and per person sits 47th on our composite rather than 50th: giving the alcohol share more weight would have rewarded a state for not testing. Speeding involvement is coded by the officer at the scene, which is why it carries only 5%.

The second caution is arithmetic. Vermont recorded 59 crash deaths in 2024. Its 41% alcohol share is 24 people and its 54% speeding share is 32. A single multi-fatality crash moves those percentages by several points, and Vermont's 0.82 deaths per 100 million miles is the fifth-best rate in the country. Where the behavior columns are large and the death counts are too, the label sticks: Montana (37% alcohol, 43% speeding), South Carolina (40% and 38%) and Arizona (34% and 36%) all sit in the bottom five, and Texas (40% and 36%) is 40th, with hundreds to thousands of deaths behind each percentage.

Belt use follows the law on the books more than the local character

NHTSA's state survey note reports that 26 states and the District of Columbia reached 90% belt use or higher in 2024, and it explains the split in one line: 68% of jurisdictions with primary enforcement laws were at 90% or better, against 7% of those with secondary enforcement or no adult belt law. Primary enforcement means an officer can stop a car for the belt alone. The national figure from NHTSA's own roadside survey was 91.2%.

The low end of the table is Wyoming at 73.4%, Arkansas 77.7%, New Hampshire 78.2%, Montana 79.3% and North Dakota 79.8%. The high end is California 97.5%, Hawaii 97.2%, Oregon 95.5% and Connecticut 95.0%. Wyoming's number is also the sharpest one-year fall in the note, down 8.5 points from 81.9% in 2023.

Why it belongs in a driver ranking: belts decide who survives the crash that has already happened. IIHS reports that only 46% of passenger vehicle occupants killed in 2024 were restrained, against roughly nine in ten belted on the road. In Wyoming, 41 of the 67 occupants killed, 61%, were unbelted. The exception that proves the point is Massachusetts: 84.4% belt use, one of the lowest in the country, and still the best death rate per mile. Belts limit the damage of a crash; density, speed and road design decide how many crashes there are.

The extremes look nothing alike, and one year can move a small state ten places

Massachusetts recorded 363 deaths on about 62 billion miles in 2024: 0.59 per 100 million miles and 5.1 per 100,000 people, with 8% of those deaths on rural roads. Rhode Island's 4.7 per 100,000 is the lowest per-capita figure of any state. Minnesota tops the composite without winning any single column: 0.81 per mile, 8.2 per 100,000, 23% alcohol, 94.7% belt use. FARS shows Minnesota rising from 402 deaths and 0.69 per 100 million miles in 2023 to 477 and 0.81 in 2024.

Mississippi is the other pole: 1.81 deaths per 100 million miles and 25.6 per 100,000 people, three times Massachusetts per mile and five times per person, with 67% of deaths rural and 81.2% belt use. Montana finishes last on the composite because every column is bad at once: 1.49 per mile, 18.1 per 100,000, 37% alcohol, 43% speeding, 79.3% belt use, 79% rural. South Carolina, second to last, combines 1.67 per mile with the highest alcohol-impaired death rate per mile in the country.

Small states move. FARS has Wyoming falling from 144 deaths and 1.51 per 100 million miles in 2023 to 107 and 1.10 in 2024, Kentucky improving from 1.66 to 1.44, and Maine going the other way from 0.91 to 1.17, with Alaska up from 1.09 to 1.27. The big states barely twitch: California 1.19, Texas 1.35 and Florida 1.26 each moved by roughly a tenth of a point. A state's place in a table like this is a reading, not a verdict, and the smaller the state the more that is true.

A state's crash record moves your insurance bill, but not in the direction the death table suggests

Insurers price the claims they expect to pay, and NAIC's premium supplement says so directly: rates rest mainly on what the insurer expects to pay out in claims. Its list of what moves a state's average includes accident rates, driving locations, traffic density and auto laws such as seat belt and speed limits, alongside repair costs, medical and legal costs and theft. For 2023, the latest data year in that series as of September 2026, NAIC puts the countrywide average expenditure per insured vehicle at $1,281, with a median state at $1,114.

The link between crash deaths and premiums is real but loose. The three most expensive states in NAIC's 2023 table were Florida at $1,864, New York at $1,753 and Louisiana at $1,749; New York is sixth-best on our composite. The cheapest were North Dakota at $808, Maine at $856, Idaho at $864 and Iowa at $869, rural states that all finish in the top 30 here. Montana, last on our list, averaged $975; Massachusetts, best per mile, $1,326. Deaths cluster on fast rural roads where crashes are rare but unsurvivable. Claims cluster in dense traffic where crashes are frequent, cars are expensive to fix and injury lawsuits are common. Both are a state's crash record; they describe different crashes.

For a used car, the useful reading is about what the miles mean. Roughly 16,500 miles a year is ordinary for a Wyoming resident; the same odometer in New York, where the figure is nearer 6,100, reads as heavy use. A vehicle history report and an independent inspection are worth having anywhere; no state table changes that. What geography changes is the seller's story: a folder of service records that accounts for high mileage is what separates a well-kept rural car from a tired one, and it answers the buyer's first question before it is asked.
Common questions

What people ask about this

Which state has the worst drivers by this ranking?

Montana finishes last on our composite for 2024 because it is poor in every column at once: 1.49 deaths per 100 million miles, 18.1 per 100,000 people, 37% of deaths involving an alcohol-impaired driver, 43% speeding-related and 79.3% belt use. Mississippi has the worst raw death rates by a wide margin, 1.81 per 100 million miles and 25.6 per 100,000, but ranks 47th because its alcohol share rests on very little BAC testing.

Which state has the safest drivers?

Minnesota ranks first on the composite with 0.81 deaths per 100 million miles, 8.2 per 100,000 residents, a 23% alcohol-impaired share and 94.7% belt use. Massachusetts has the lowest rate per mile of any state at 0.59, and Rhode Island the lowest per person at 4.7 per 100,000. New Jersey, Utah, Massachusetts and Rhode Island round out the top five, with New York sixth; all are dense states where residents drive relatively few miles at lower speeds.

Why rank states on deaths instead of crashes or tickets?

Fatal crashes are what NHTSA compiles state by state under one definition in the Fatality Analysis Reporting System, so they can be compared across state lines. There is no equivalent national table of fender-benders or citations, and insurer-based lists reflect one company's customers. Deaths are a hard count, which is why the two death rates carry 70% of our weighting and the behavior shares, which depend on testing and coding, carry the rest.

Does living in a high-fatality state mean higher car insurance?

Not reliably. NAIC's 2023 figures put New York, sixth-best on our composite, among the three most expensive states at $1,753 per insured vehicle, while Montana, last on our list, averaged $975 and North Dakota $808. Insurers price claim frequency and cost, which concentrate in dense traffic with expensive repairs and injury litigation. Fatalities concentrate on rural high-speed roads. Both are part of a state's crash record, but they describe different crashes.

Why is Vermont so high on alcohol and speeding yet mid-table overall?

Small numbers. Vermont recorded 59 crash deaths in 2024, so its 41% alcohol-impaired share is 24 people and its 54% speeding share is 32. One multi-fatality crash can move those percentages by several points. On the measures that dominate our weighting, Vermont is strong: 0.82 deaths per 100 million miles, the fifth-best rate in the country, and 9.1 per 100,000 residents. Vermont also tests nearly all of its killed drivers for alcohol, so its share is better measured than most.

Rather just sell the car?

Get My Instant Offer → Online · about 2 minutes · free

Or send the details — we'll come to you

Selling in one of the rough states, or anywhere else? Tell us about the car and we will make an offer for it wherever it sits.

or call/text (877) 405-1808